
Strategic Priorities
The North Dakota Tourism Division uses research to strategically analyze visitor activity, interest, market share, target markets, advertising effectiveness (ROI) and more. Internal efforts are complemented by national and international research provided by the U.S. Travel Association and contracted vendors.
Annual Report
Through strategic marketing, industry partnerships, and a commitment to showcasing all that North Dakota has to offer, we continue to see growth in visitor interest, economic impact, and engagement with our Be Legendary brand.
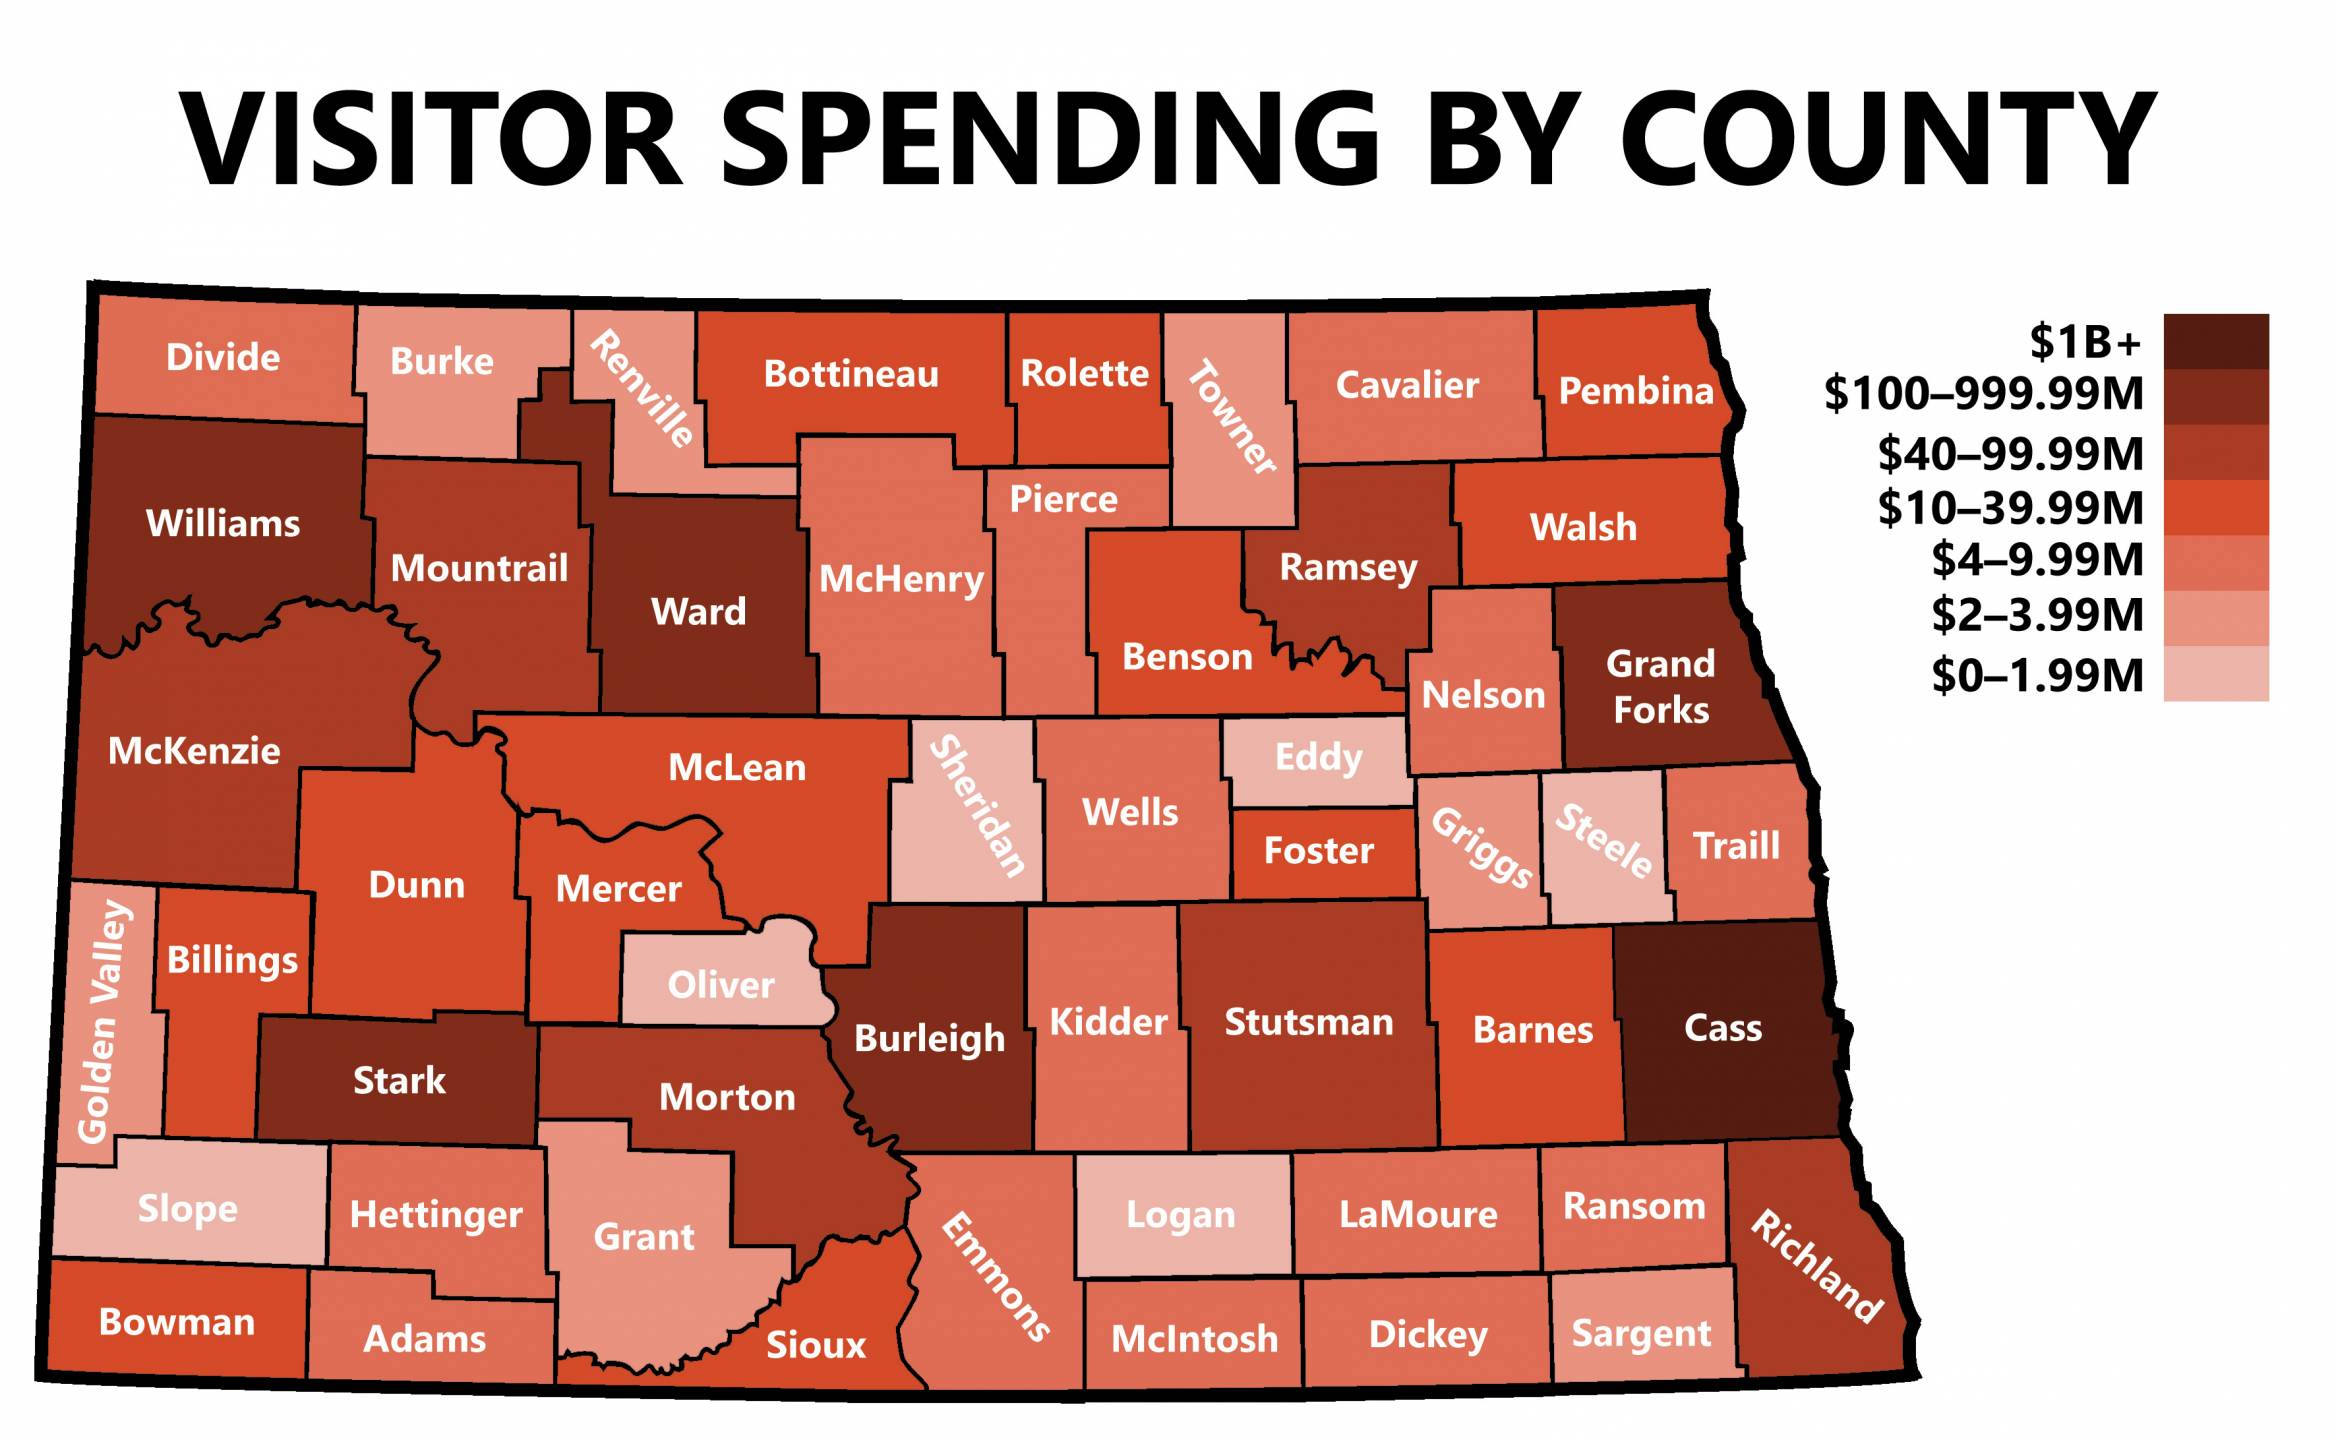
North Dakota tourism is thriving! Visitation reached a record 26.3 million in 2024, with visitor spending exceeding $3.4 billion. Day trips are a growing trend, with 18.4 million visitors enjoying the state's offerings without overnight stays. Cass County remains the leader in visitor spending, while all counties saw an average growth of 2.5%. However, the hospitality industry is still recovering from pandemic closures. Despite this, tourism's positive impact extends beyond the industry, generating over $310.6 million in tax revenue, resulting in an annual savings of $935 per North Dakota household.
New Fact Sheets Available
Image and Halo Study
Image research identifies national perceptions of North Dakota, as well as the overall awareness of the state and its advertising. The advertising’s lift on state image and economic development image is noted in the Halo Study.
TSA: Economic Impact of Tourism
A Tourism Satellite Account is a detailed measure of tourism’s economic impact in North Dakota. County-level visitor spending is also available for the 2024 travel year.
ROI: Advertising Effectiveness
This research shows the awareness of North Dakota Tourism campaigns and power in motivating visitation and visitor spending, along with the Return on Investment.
Workforce
This study was designed to gain insights into why people moved, their perceptions of living in the state, and what advice these new residents have for attracting other people to North Dakota.
North Dakota Tourism tracks visitors and spending trends and reports finding to its partners in several ways, including quarterly visitation statistics and annual report. If you are a partner who would like to participate in our statistics program, or would like more information, please contact Penny Blotsky or call (701) 328-7265.
North Dakota Tourism tapped Longwoods International for an analysis of visitation, visitor behavior, demographics and trip characteristics in order to better understand domestic visitation to the state.
A new National Park Service (NPS) report shows that visitors to Fort Union Trading Post National Historic Site, Knife River Indian Villages National Historic Site and Roosevelt National Park in 2024 spent $57 million in communities near these parks. That spending supported 576 jobs in the surrounding areas.
The parks welcome visitors from across the country and around the world. Click here for the Summary.
- Brand USA Roadshow Nordics took place Oct. 15-18 in Stockholm, Helsinki, and Oslo, resulting in
meetings with 279 Travel Agents/Tour Operators. - 51 tour operator leads from 12 countries were obtained during Brand USA Travel Week, Oct. 21-24 in
London, United Kingdom. - December brought a Great American West Trade mission. Visiting the cities of Paris, Nice and
London led to meetings with 29 travel trade companies (France–10 / United Kingdom–19) and 18
media outlets (United Kingdom). - Disbursed $2.27M to Destination Development Grant projects. With matching funds, this represents
a $4.54M investment in North Dakota tourism infrastructure in Q4 2024. - Registration for the Tourism Literature Distribution Program opened in December. 57 partners signed
up to have their travel literature distributed in select rest areas and visitor centers across North
Dakota. - Group Travel brought in 14 overnight tours and three day-trip tours, for an estimated economic
impact of $182,125. - The annual Travel Industry Marketing Summit was held in October to release the 2025 Media and
Cooperative Advertising Plans. More than 100 tourism professionals from around the state attended. - A two-day photo and film shoot was held in southeast North Dakota to develop new hunting
creative. - Q4 saw a slowing of both visitation metrics and signals of intent to travel.
- Website traffic, while having a record year, netted just a 4.71% increase over Q4 of 2023.
- Border crossings from Canada were 6.26% higher than the previous year’s quarter.
- Hotel occupancy ended Q4 2.1% lower than the same quarter, 2023.
- Theodore Roosevelt National Park adjusted visit counts in June-November, and as a result,
visitation was reported as down 1.85% from 2023. - Hospitality tax revenue in Q4 was 1.11% ahead of 2023.
Q3 Statewide Tourism Updates
Theodore Roosevelt National Park breaks visitation record.
- The quarter ended with Theodore Roosevelt National Park breaking their 2021 visitation record. Through September, the National Park had welcomed 875,257 guests with visitation 30% higher than last year.
- Hotel occupancy continued to outperform the U.S. and west north central region, with revenue 7.8% ahead of 2023.
- August saw a 14% increase in border crossings, and thru that month visitation from Canada was 12.7% higher than 2023.
- ESTO, Columbus OH – ND Tourism moderated the Professional Development session for Domestic and International trade.
- Tribal Leaders Summit: ND Tourism moderated the Tourism session - “What Does Tourism Mean to You? The Positive Effects and Benefits.” Native tourism development builds community capacity, creates jobs, educates visitors and helps sustain a tribe’s culture and environment.
- FAMS: 4 hosted, 3 markets, 32 days spent in ND, 22 cities visited.
- Set up national podcast interview for Jeb Williams, Director of ND Game & Fish to be on The Flush Podcast with Travis Frank. The episode premiered September 19.
- Worked with host of Rush Outdoors TV, Tim Andrus to set up a hunt for an episode of Rush Outdoors near Bowdon, North Dakota.
- Participated in and collected digital assets at the Sheyenne Riverfest in Valley City August 2.
Q2 Statewide Tourism Updates
North Dakota outperformed the nation in lodging demand and air passengers during Q2 and visitation indicators were strong.
- Economic impact data for counties was released during the quarter, showing an average growth of 8.8% in visitor spending.
- In June, statewide hotel occupancy rose to the highest level seen since June of 2014.
- Hotel occupancy slightly lagged behind 2023 but revenue increased 4.4%.
- Visits to Theodore Roosevelt National Park increased 18% with June recording the most visited month to date.
- Border crossings increased 12.1% during the quarter but remained approximately 83% the volume of 2019.
- GAW Summit & International Round-up - Casper, WY: 49 leads from all 7 international markets.
- US Travel’s IPW - Los Angeles: 90 leads from 17 countries. Top five were Germany, Nordics, UK, Benelux and France.
- German media spent 3 ½ days visiting Medora, Theodore Roosevelt National Park, and MHA Tourism.
- Italian Media spent 5 days in state visiting, Wahpeton, Fargo, Cooperstown, New Rockford, Ft Totten, Devils Lake, Turtle Mountain Band of Chippewa, International Peace Garden, Rugby, and Standing Rock National Native American Scenic Byway.
- Traveled 3,000+ miles across North Dakota to set up brochure racks in all 15 rest areas. Distributed over 12,000 Travel Guides and 18,250 Highway Maps in rest areas.
- Group Travel brought in 22 tours resulting in 57 overnights for 779 guests, creating an estimated revenue of $434,124.
Q1 Statewide Tourism Updates
Pleasant weather and notable marketing activities has 2024 off to a great start for the travel industry.
- Website traffic surged, ending the quarter 65.5% higher than Q1 2023.
- Arrivalist verified more than 1.7 million U.S. trips to North Dakota; a 2.2% increase.
- Hotel occupancy slightly lagged behind 2023 but revenue increased 4.4%.
- Border crossings were available through February and were 22.4% higher than 2023.
- After a cold January, visits to Theodore Roosevelt National Park rebounded in February and March for a quarter ending 18.8% higher than 2023.
- Attended and spoke at Buffalo Grande Foundation Ribbon Cutting in Hettinger.
- Attended GO West Summit with 40 appointments with international tour company representatives. Attended ABA with 58 appointments with group travel representatives.
- Oslo mission with Fargo-Moorhead CVB resulted in good quality appointments with Nordic travel trade representatives. Connected with 26 travel trade representatives at International Inbound Tour Operators (IITA). German sales mission resulted in 181 leads and meetings with 40 media representatives.
- Arrivalist verified more than 2.2 million U.S. visits during the quarter, which was a 21% increase over Q4 2022. Day trips increased 15% over the previous year.
- Border crossings from Canada were 21% higher than Q4 2022. Canadian visitation is the only area that hasn’t fully recovered to 2019 levels.
- Due to a high-performing program with Midwest Living, traditional inquiries surged during Q4 and were 72% higher for the quarter, ending the year 7% ahead of 2022.
- Hotel occupancy remained high for the quarter, ending 6.7% ahead of Q4 2022. North Dakota’s occupancy, ADR and RevPAR all had increased that outperformed the national average.
- KFYR-TV interview about fall pheasant hunting and the economic benefit of hunters.
- London Travel Week and Italian Mission lead to contacts across six of our markets. International media reached nearly 196M.
- The Tourism Division’s annual staff familiarization tour took the team to the north unit of Theodore Roosevelt National Park, Watford City, Tobacco Gardens, Fort Union, Fort Buford, the Confluence, Williston, Lund’s Landing, the Links of North Dakota and Garrison.
- Visitation remained strong throughout the quarter. Highlights include:
- Hotel occupancy rates that outperformed the national average in July, August and September. The September OCC % was 7.2% higher than 2022.
- Border crossings from Canada were 38.5% higher than 2022, but remain 76% of the volume seen in 2019.
- September 2023 was the first month that in-state air arrivals met the volume seen in 2019.
- Arrivalist estimated a 10.4% increase in visitation over the same quarter last year.
- Signals of intent to travel were improved with website sessions, Facebook page visits and live chats all exceeding 2022 volume.
- Hotel occupancy rates that outperformed the national average in July, August and September. The September OCC % was 7.2% higher than 2022.
- 138 international tour operators offering North Dakota product, up 10% YOY. Estimated rooms booked up 154% over 2019. Italian, Dutch and UK media FAMs resulted in ad equivalency of $162K and a reach of nearly 13.4M.
- Recorded 79 group tours with more than $1.5M in economic impact.
- Story ideas pitched to 35 qualified outdoor media at AGLOW.
- Rest area distribution included more than 30K Travel Guides and 61.5K highway maps.
- Statewide hotel occupancy is at its highest level in years and outpacing national growth. Year-to-date occupancy is 7.4% higher than 2022, ADR is 9.3% higher and RevPAR is 17.4% ahead of 2022.
- Visitation metrics are strong at the mid-year point.
- Arrivalist reports 7.67% higher total visitation.
- Deplanements are 11% higher than 2022.
- Border crossings for the quarter were 50% ahead of 2022.
- Visitation to Theodore Roosevelt National Park is up 12.46% with its second-highest visited June in history. - 47 international tour operator appointments at International Roundup and 87 appointments at US Travel’s IPW. International media reach of 29M with an ad equivalency value of nearly $761K.
- 20 group tours with estimated $270K in economic impact.
- Hosted Heliconia Productions to produce an episode of the show “Epic Trails” with Eric Hanson. Sites visited include Theodore Roosevelt National Park, the Maah Daah Hey Trail and Lake Sakakawea.
- The average statewide hotel occupancy has surpassed 2019 levels and is at an eight-year high.
- January visitation to Theodore Roosevelt National Park was 32% higher than its 10-year monthly average. But weather impacted visits in February and March.
- January deplanements outperformed 2019.
- Border crossings into North Dakota from Canada were 151% higher than 2022, but remain only 75% recovered from pre-pandemic closures.
- Through mid-March, Arrivalist has verified 567k U.S. road trips to North Dakota with 48% spending at least one night in a destination. Q1 growth has been seen from primary markets including Minnesota, South Dakota, Montana, Colorado and Wyoming.
- International Inbound Travel Association Summit resulted in 24 appointments with 25 leads generated. International media featured North Dakota in 51 stories reaching more than 225M with an ad value of $2.11M.
- Group travel shows, including American Bus Association, Go West, and Midwest Marketplace, resulted in 109 appointments.
- More than 700 people stopped at the North Dakota booth at the Northwest Sportshow in Minneapolis.
- Hosted a writer from Outsider Magazine to do a winter story featuring the national park.