
Strategic Priorities
The North Dakota Tourism Division uses comprehensive research and data-driven insights to guide strategic decision-making and maximize impact. By continuously evaluating visitor behavior, traveler interests, market share, target audiences, and advertising performance (ROI), efforts remain focused, measurable, and results-driven. Internal analytics are further strengthened by national and international research from the U.S. Travel Association and trusted partners, helping benchmark performance and stay aligned with evolving travel trends.
Tourism in North Dakota is a $3.4 billion industry that supports more than 46,000 jobs and positively impacts communities in every city and county across the state.
To measure this impact, North Dakota Tourism collects and analyzes data on visitation, visitor spending, tax revenue, and employment in travel-related sectors. The information below highlights key metrics used to track trends and assess the overall health of the industry statewide.
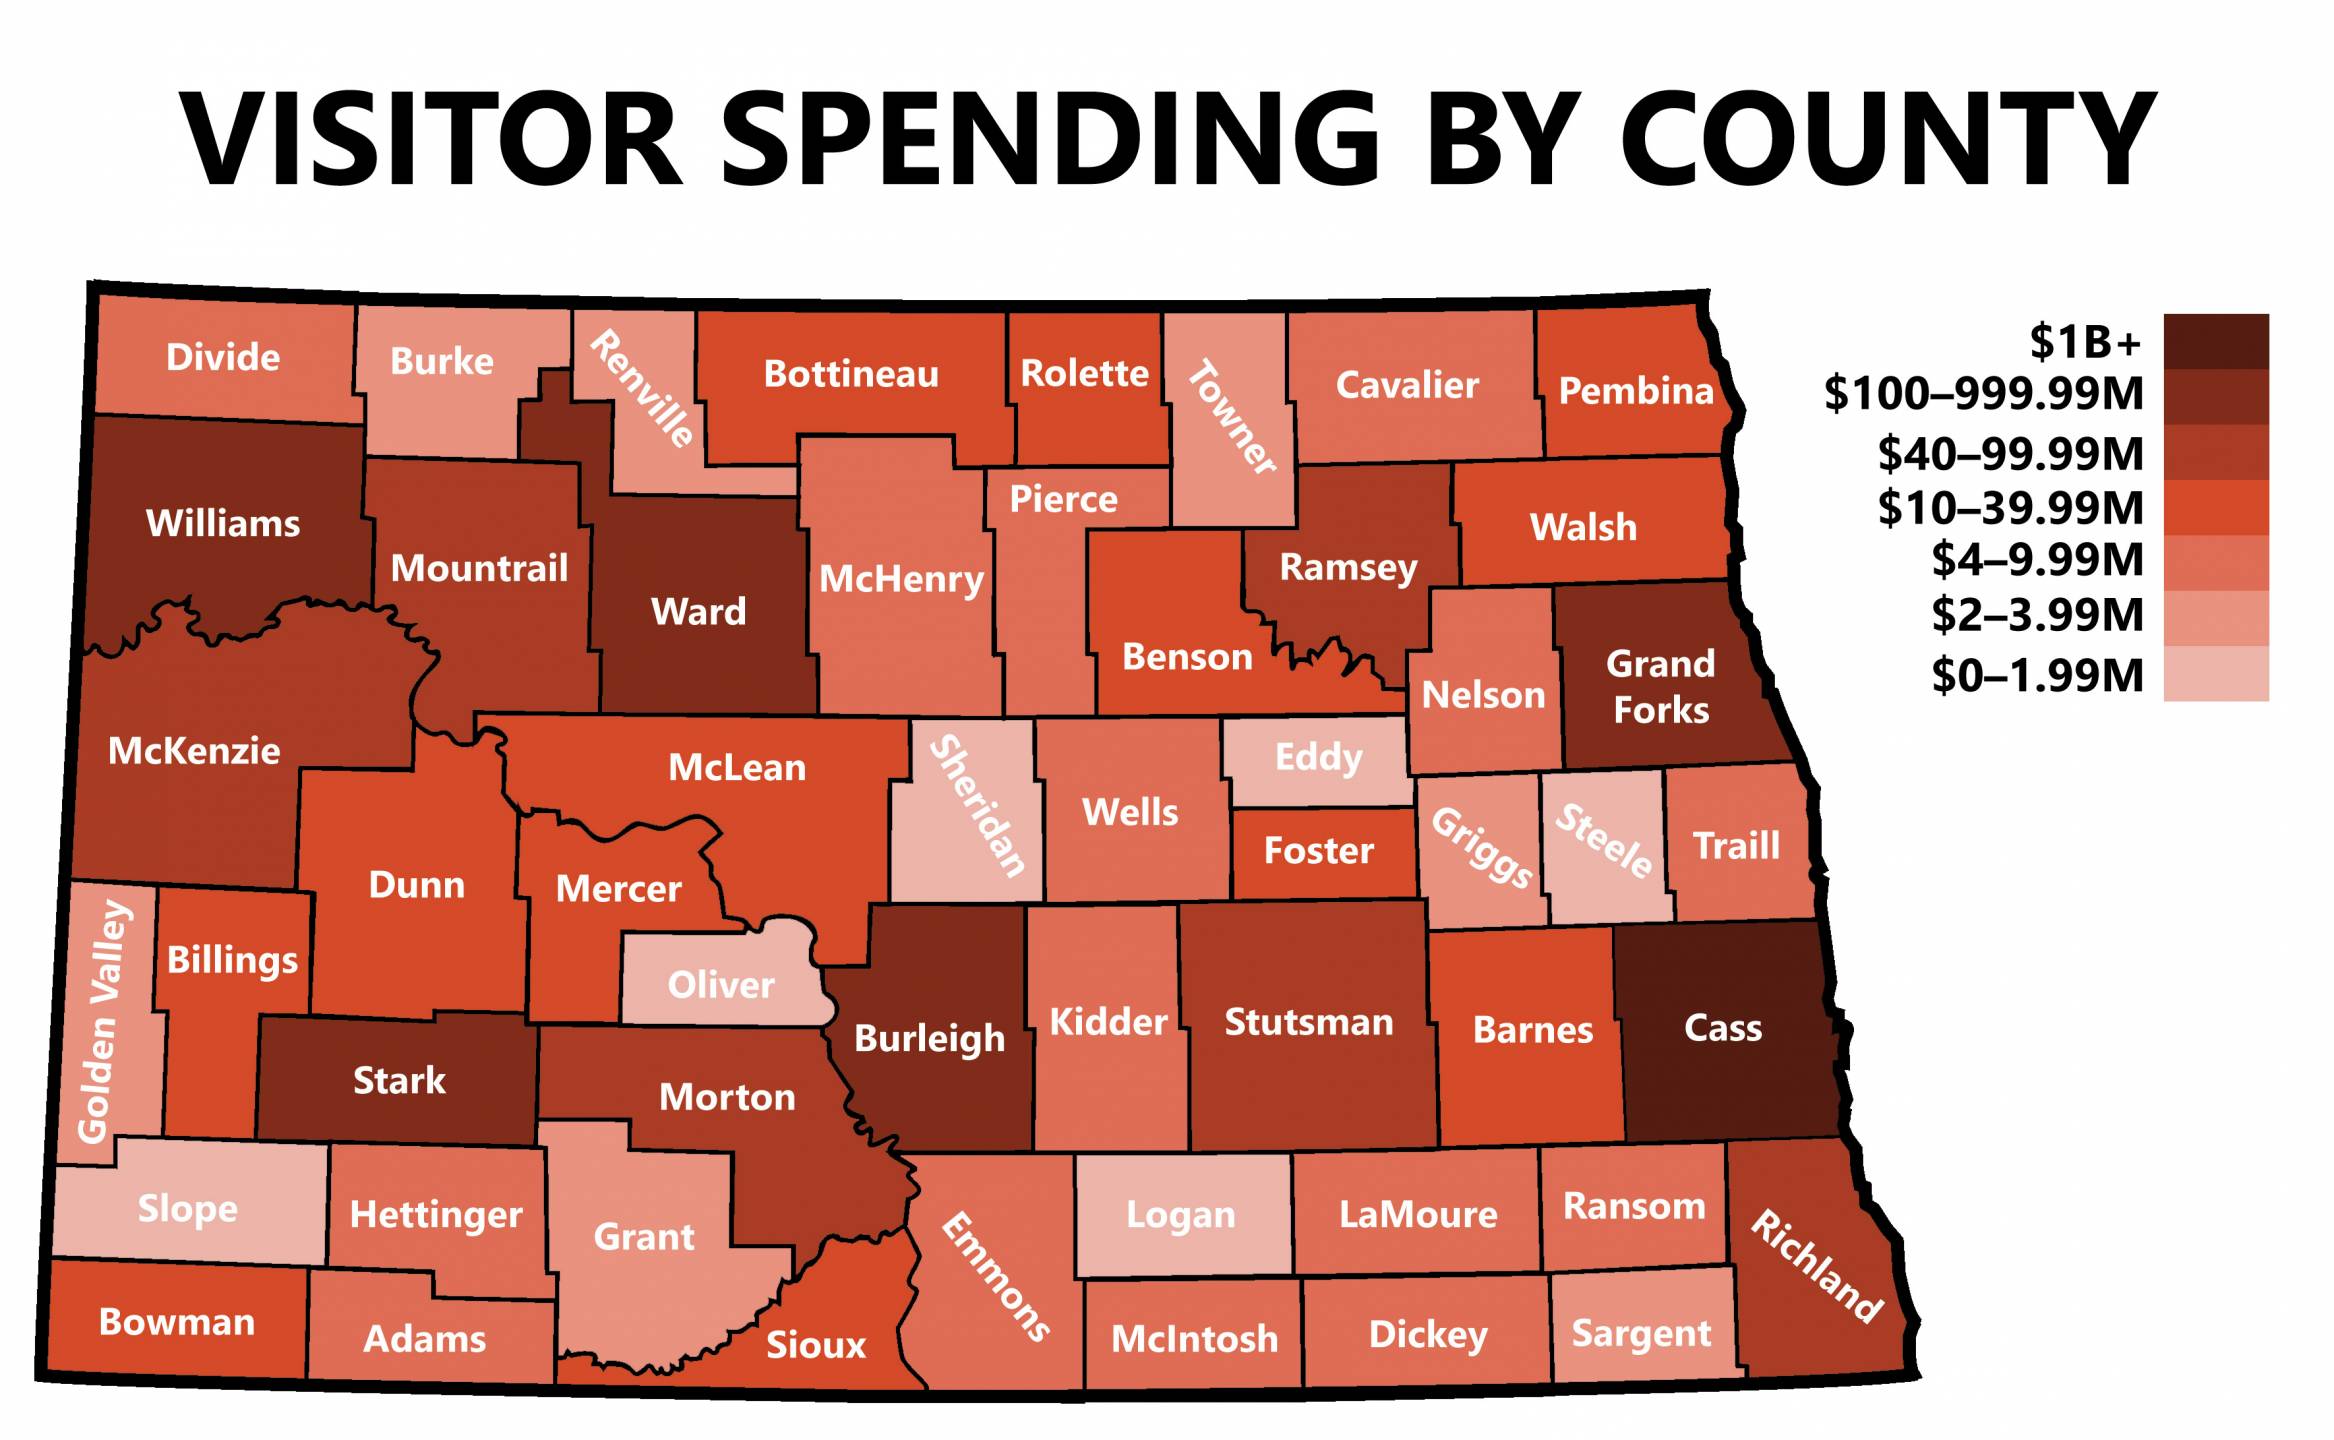 North Dakota tourism is thriving! Visitation reached a record 25.6 million in 2025, with visitor spending exceeding $3.4 billion. Day trips are a growing trend, with 18 million visitors enjoying the state's offerings without overnight stays. Cass County remains the leader in visitor spending, and in 2024, all counties saw an average growth of 2.5%. However, the hospitality industry is still recovering from pandemic closures. Despite this, tourism's positive impact extends beyond the industry, generating over $304.4 million in tax revenue, resulting in an annual savings of $919 per North Dakota household.
Annual Report
Through strategic marketing, industry partnerships, and a commitment to showcasing all that North Dakota has to offer, we continue to see growth in visitor interest, economic impact, and engagement with our Be Legendary brand.
Image and Halo Study
Image research identifies national perceptions of North Dakota, as well as the overall awareness of the state and its advertising. The advertising’s lift on state image and economic development image is noted in the Halo Study.
TSA: Economic Impact of Tourism
A Tourism Satellite Account is a detailed measure of tourism’s economic impact in North Dakota. County-level visitor spending is also available for the 2025 travel year.
ROI: Advertising Effectiveness
This research shows the awareness of North Dakota Tourism campaigns and power in motivating visitation and visitor spending, along with the Return on Investment.
Longwoods Visitor Study
This report provides an overview for North Dakota’s domestic tourism business in 2023.
This study was designed to gain insights into why people moved, their perceptions of living in the state, and what advice these new residents have for attracting other people to North Dakota.